Travel time
Travel time can be easily shown for each agent. Note that we are not showing the agent ID on the x-axis since there might be too many of them (and the individual agent travel time in MATSim does not mean much anyway …)
The necessary dependancies can be imported as:
from process.agent import get_agent_travel_time, get_all_agents, select_agents
from process.network import get_network
from process.plans import get_plans
from process.utils import get_diags_time_range, setup_logging, str2datetime
from process.vis.travel_time import plot_travel_time
We also need to define the inputs and output for the simulation:
plans_path = "data/example1/output_plans.xml.gz"
network_path = "data/example1/output_network.xml.gz"
diags_start_datetime = "07:30:00"
diags_end_datetime = "08:30:00"
output_path = "etc/animation3.png"
Finally the following codes will give us the travel time for each agent
diags_start_datetime = str2datetime(diags_start_datetime)
diags_end_datetime = str2datetime(diags_end_datetime)

agents = select_agents(get_all_agents(plans_path))

logger.info("read all networks ...")
all_links = get_network(network_path)

logger.info("obtain time range ...")
all_times = get_diags_time_range(diags_start_datetime, diags_end_datetime)

agent_travel_time = {}
for proc_agent in agents:
    all_tasks = get_plans(plans_path, proc_agent)
    agent_travel_time[proc_agent] = get_agent_travel_time(all_tasks)

plot_travel_time(agent_travel_time, output_path=output_path)
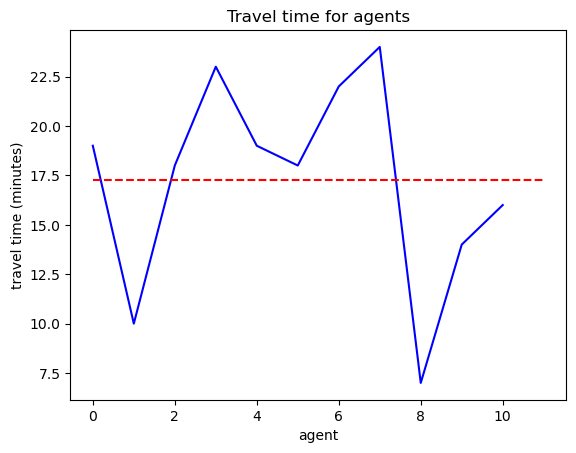
Where the red line indicates the average travel time over all agents.