Emissions (Petrol car vs Diesel truck)
Assuming that there are two scenarios:
all agents travel via petrol cars
all agents travel via diesel trucks
In this section we will compare the emissions between these two scenarios
Note
A few chemicals are included in the MATSim emission extension: CO, CO2, FC, HC, NMHC, NO2, NOX, PM, SO2
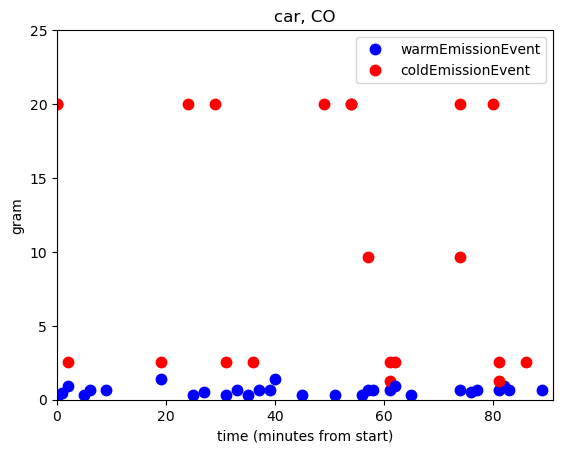
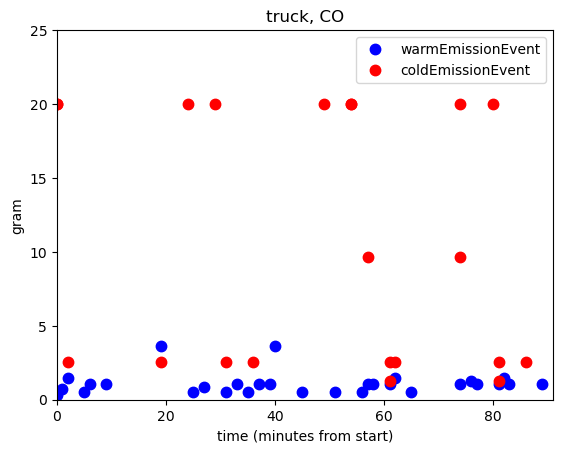
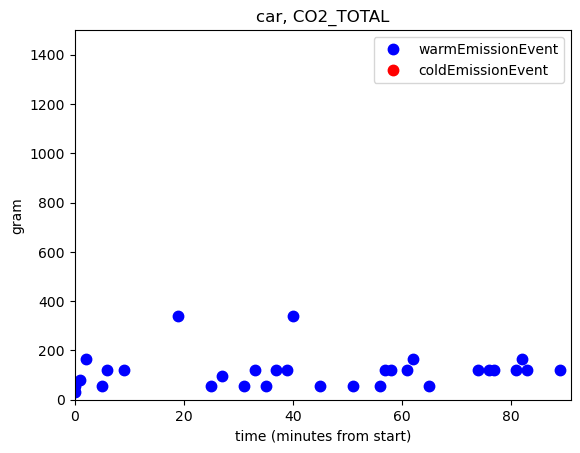
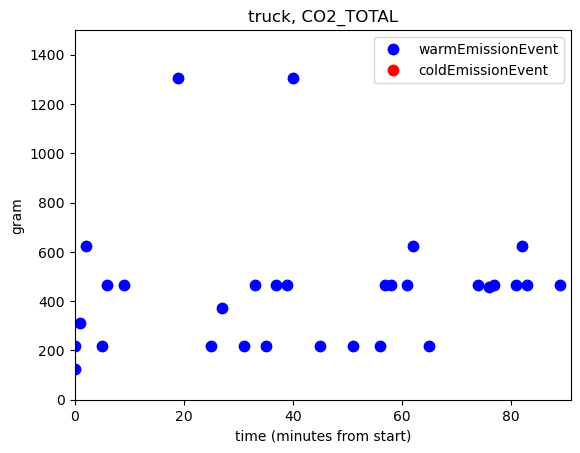
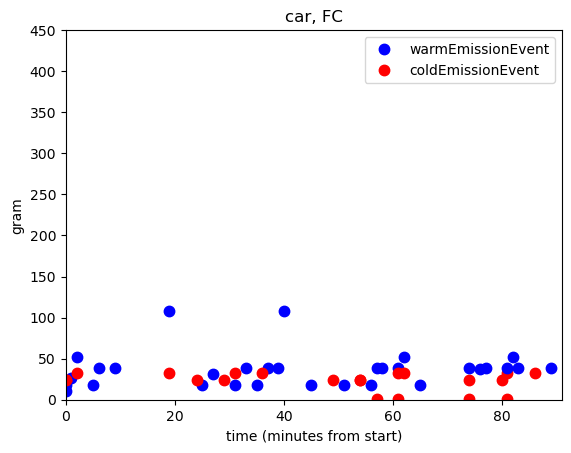
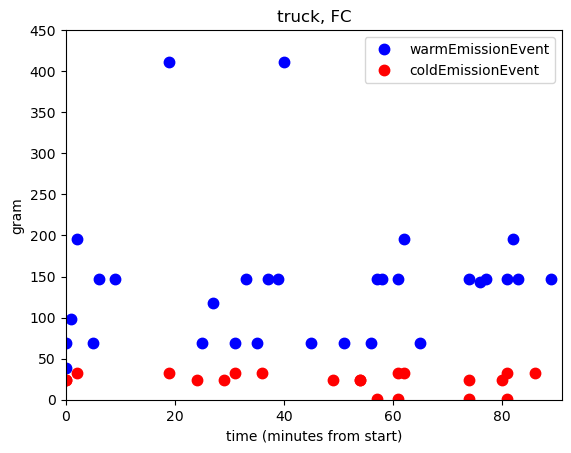
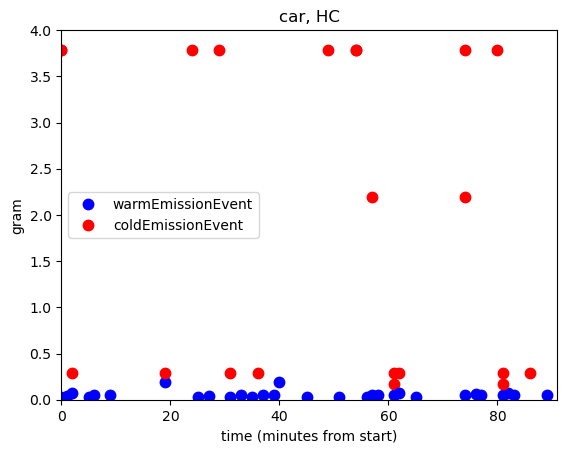
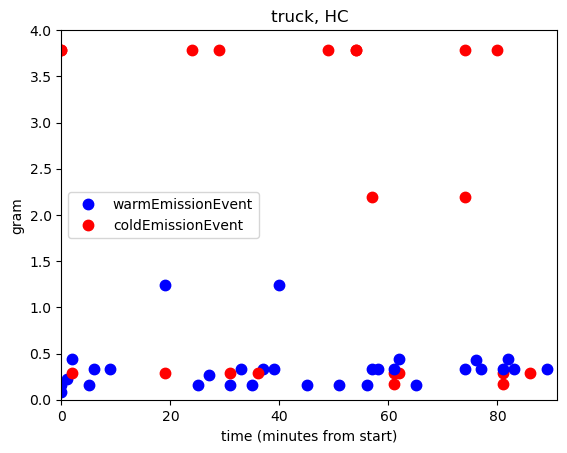
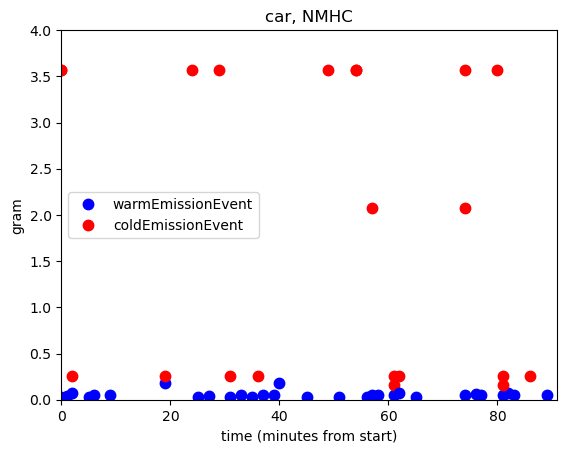
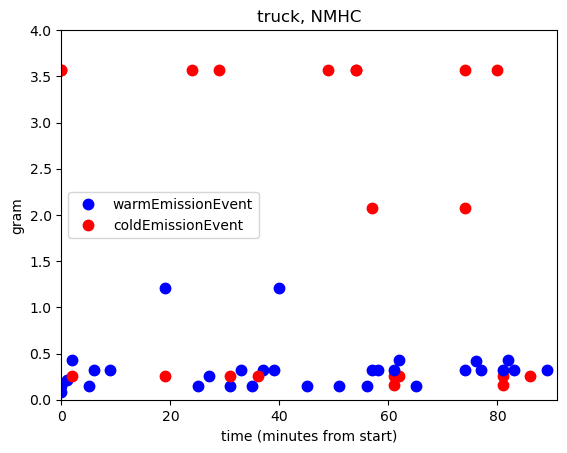
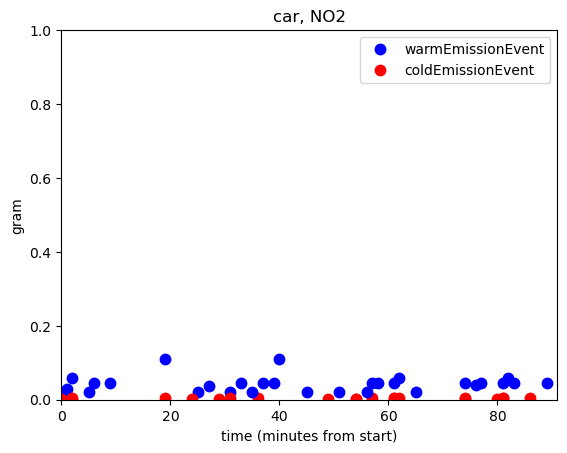
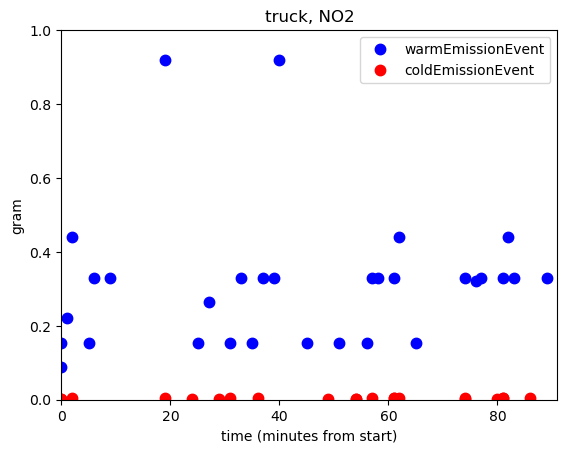
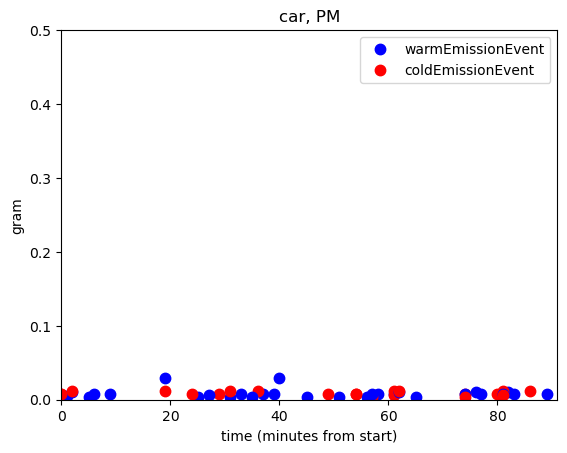
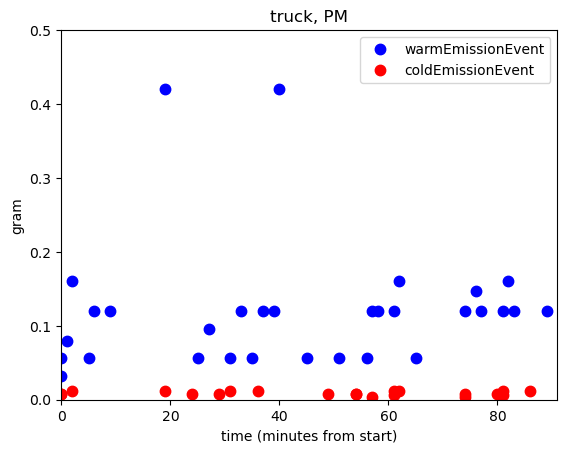
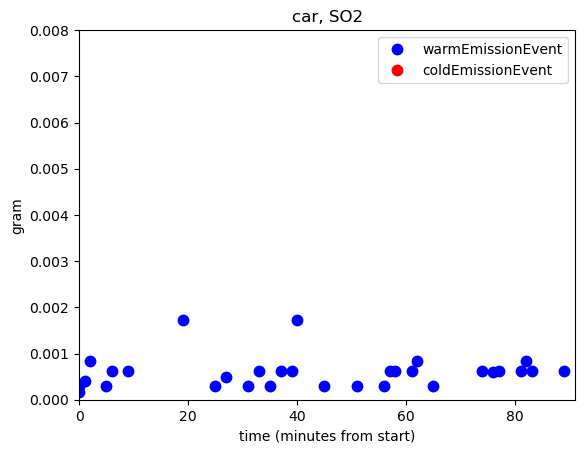
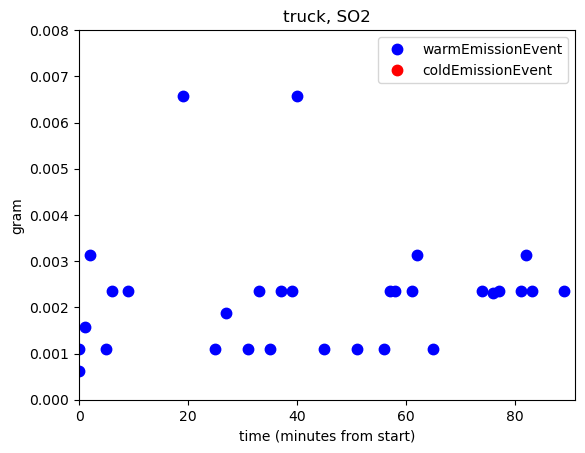
The comparisons between truck and car emissions
From this simple example, we can see that the diesel truck provides more emissions than the car, especailly for a few chemical types such as SO2 and PM
The codes used to provide such comparisons are shown below:
from matplotlib.pyplot import (
    close,
    legend,
    plot,
    savefig,
    title,
    xlabel,
    xlim,
    ylabel,
    ylim,
)
from numpy import NaN
from process import EMISSION_TYPES
from process.agent import (
    get_agent_movement,
    get_all_agents,
    interp_agent_movement,
    select_agents,
)
from process.event import get_emission
from process.facility import get_facility
from process.network import get_network
from process.plans import get_plans
from process.pt import get_pt
from process.utils import get_diags_time_range, setup_logging, str2datetime
from process.vis.movement import plot_movement

# export PYTHONPATH=/home/szhang/Github/matsim-vis:$PYTHONPATH
# xml_path = "/home/szhang/Github/matsim-example-project/output/output_events.xml.gz"
event_path = "data/example3/petrol/output_events.xml.gz"
plans_path = "data/example3/petrol/output_plans.xml.gz"
diags_start_datetime = "07:00:00"
diags_end_datetime = "08:30:00"


diags_start_datetime = str2datetime(diags_start_datetime)
diags_end_datetime = str2datetime(diags_end_datetime)
all_times = get_diags_time_range(diags_start_datetime, diags_end_datetime, time_interval_min=1)

agents = select_agents(get_all_agents(plans_path))

total_emission = {}
for agent in agents:
    total_emission[agent] = get_emission(event_path, agent, all_times)

data_range = {
    "CO": [0, 25],
    "CO2_TOTAL": [0, 1500],
    "FC": [0, 450],
    "HC": [0, 4.0],
    "NMHC": [0, 4.0],
    "NO2": [0, 1.0],
    "NOX": [0, 0.05],
    "PM": [0, 0.5],
    "SO2": [0, 0.008]

}

for emission_type in EMISSION_TYPES:
    for agent in agents:
        data_to_plot = {}
        for emission_name in ["warmEmissionEvent", "coldEmissionEvent"]:
            data_to_plot[emission_name] = []
            for proc_time in all_times:
                data_to_plot[emission_name].append(total_emission[agent][emission_name][proc_time][emission_type])

            if emission_name == "warmEmissionEvent":
                color_name = "b"
            else:
                color_name = "r"

            plot(data_to_plot[emission_name], f"{color_name}o", markersize=7.5)

    plot([NaN], f"bo", markersize=7.5, label="warmEmissionEvent")
    plot([NaN], f"ro", markersize=7.5, label="coldEmissionEvent")
    legend()
    xlim(0, len(data_to_plot[emission_name]))
    xlabel("time (minutes from start)")
    ylabel("gram")
    ylim(data_range[emission_type])
    title("car, " + emission_type)
    savefig(f"docs/source/example/emission/petrol_{emission_type}.png", bbox_inches="tight")
    close()